As a language, Python has revolutionized the world of data science and data engineering, making it easier to analyze, process, and visualize data. One of the reasons Python has become so popular in the data space is its vast collection of libraries that provide a wide range of functionality. In this blog, I’ll share some of the best Python libraries for data science and data engineering that I’ve used personally.
pandas/numpy
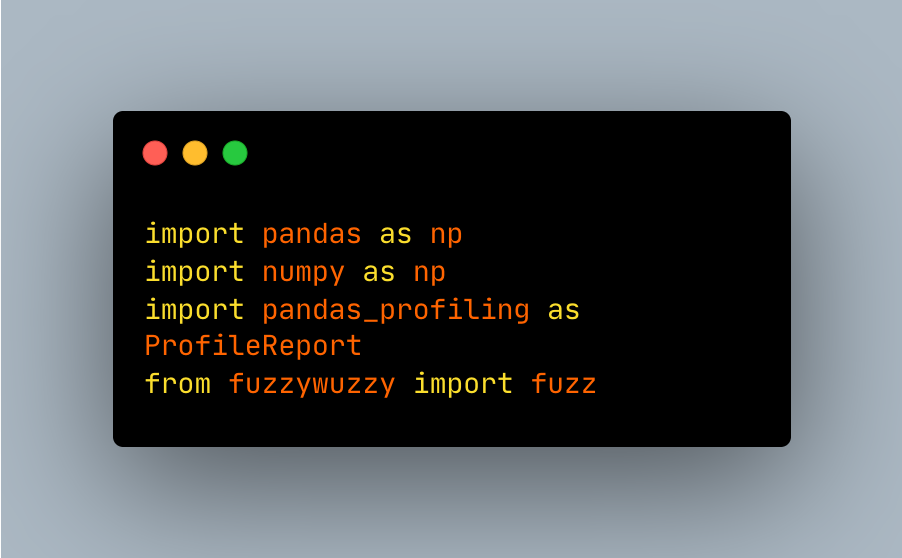
Pandas and NumPy are two of the most important libraries in Python for data analysis and manipulation. Pandas provides a high-level interface for working with structured data, including powerful tools for data cleaning, transformation, and aggregation. It’s also highly optimized for performance, making it a great choice for working with large datasets. NumPy, on the other hand, provides support for multidimensional arrays and mathematical operations on those arrays. This makes it a great choice for numerical computing and scientific applications. Together, Pandas and NumPy provide a powerful foundation for data science and data engineering in Python.
Here’s a simple example that shows how to use Pandas and NumPy to generate some random data and perform a basic calculation:
import pandas as pd
import numpy as np

# random data
data = np.random.rand(5, 3)

# create a dataframe
df = pd.DataFrame(data, columns=['A', 'B', 'C'])

# basic calculation
df['D'] = df['A'] + df['B']

print(df)
difflib/fuzzywuzzy
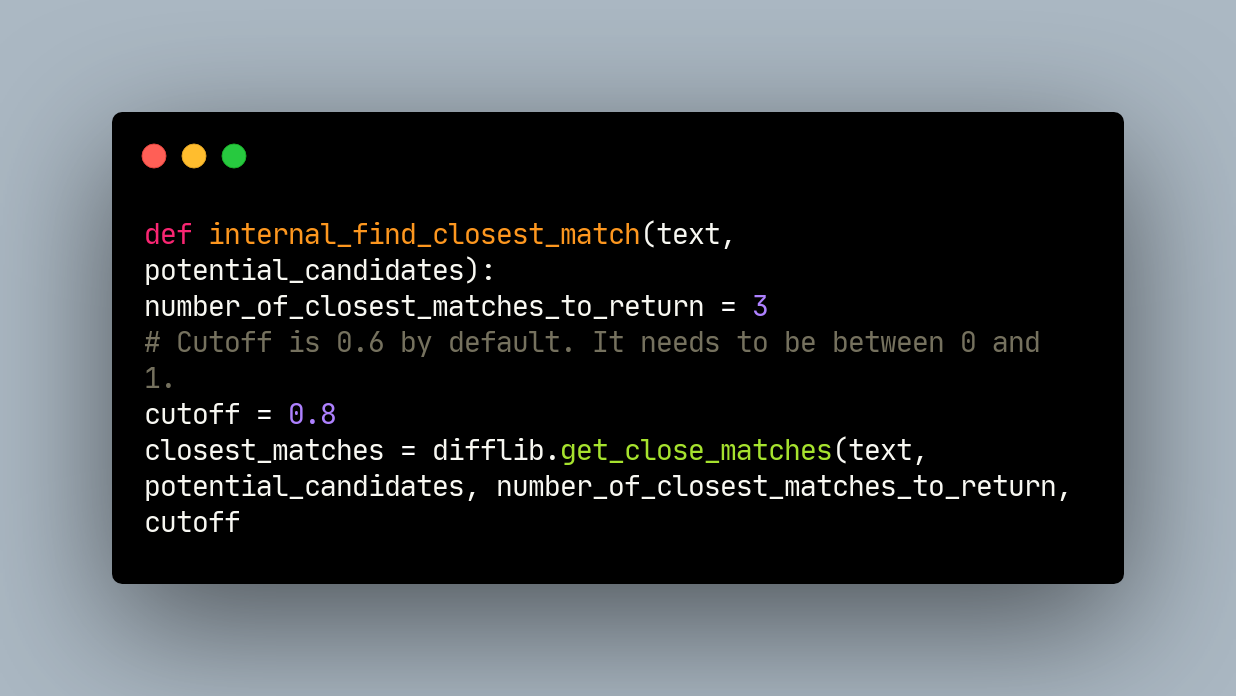
Both Difflib and Fuzzywuzzy are Python libraries that offer powerful tools for comparing and matching strings. Difflib provides a variety of methods for comparing sequences, including methods for calculating the differences between them. This can be useful for tasks like identifying changes between versions of a file or determining the similarity between two sets of data. Fuzzywuzzy, on the other hand, provides a set of tools for fuzzy string matching, which can be useful for tasks like deduplicating data or finding matches in a database. Fuzzywuzzy uses Levenshtein distance to calculate the similarity between two strings, which makes it highly effective even when dealing with strings that have typos or other minor differences.
Here’s a simple example that shows how to use Fuzzywuzzy to match two strings:
from fuzzywuzzy import fuzz

# define two strings to match
string1 = "apple pie"
string2 = "aple pei"

# calculate the similarity score between the two strings
score = fuzz.ratio(string1, string2)

print(score)
This code uses Fuzzywuzzy’s fuzz.ratio() method to calculate the similarity score between two strings. In this case, the two strings are “apple pie” and “aple pei”, which are obviously quite similar but have some typos. The fuzz.ratio() method returns a score between 0 and 100 that indicates how similar the two strings are. In this case, the score is 83, which indicates a very strong match.
ydata-profiling (recently renamed from pandas_profiling)
ydata-profiling is a Python library that generates a comprehensive report of a Pandas or Spark (from version 4.0.0)DataFrame, including statistics, visualizations, and insights. It’s a great tool for quickly getting an overview of a dataset and identifying potential issues or areas for further exploration. One of the things I love about ydata-profiling is how easy it is to use - with just a few lines of code, you can generate a beautiful and informative report that can save you hours of manual work. Additionally, the report generated by ydata-profiling is interactive, allowing you to explore the data further and get a deeper understanding of its characteristics.
Here’s an example that demonstrates how to use ydata-profiling to generate a report:
import pandas as pd
from ydata_profiling import ProfileReport

# load a dataset
df = pd.read_csv('my_dataset.csv')

# generate a profile report
profile = ProfileReport(df, title='My Dataset Report')

# save the report to a file
profile.to_file(output_file='my_dataset_report.html')
This code loads a dataset into a Pandas DataFrame and then uses pandas-profiling to generate a report. The report is saved as an HTML file, which you can open in your web browser to explore the data. The report includes a summary of the dataset, including statistics on each column, correlations between columns, and visualizations of the data. It also includes a section on potential issues, such as missing data or high cardinality columns, which can help you identify areas for further investigation. Overall, pandas-profiling is an excellent tool for anyone working with data in Python, and I highly recommend giving it a try.
sqlalchemy
SQLAlchemy is a Python library that provides a set of tools for working with SQL databases. It allows you to interact with databases in a way that feels natural to Python developers, using objects and methods rather than raw SQL queries. This can be particularly useful for data engineers who need to work with databases in their Python applications, as it allows them to write more maintainable and flexible code. SQLAlchemy provides support for a wide range of databases, including MySQL, PostgreSQL, SQLite, and Oracle, making it a versatile tool for working with data.
Here’s a simple example that demonstrates how to use SQLAlchemy to connect to a database and execute a query:
from sqlalchemy import create_engine

# connect to a SQLite database
engine = create_engine('sqlite:///my_database.db')

# execute a query
result = engine.execute('SELECT * FROM my_table')

# print the results
for row in result:
print(row)
This code uses SQLAlchemy’s create_engine() method to connect to a SQLite database, and then uses the engine.execute() method to execute a SQL query. The results are then printed to the console. One of the advantages of using SQLAlchemy is that it allows you to work with databases using a high-level API, which can make your code more readable and easier to maintain. Additionally, SQLAlchemy provides support for advanced features like transactions, connection pooling, and schema reflection, which can make it a powerful tool for working with data in production applications
great expectations
Great Expectations is a Python library that allows you to define, manage, and test data expectations in your data pipelines. It provides a powerful set of tools for validating data quality, ensuring data integrity, and identifying potential issues early in your pipeline. When used in conjunction with dbt, Great Expectations can help you build a complete data quality management system that allows you to test and validate your data at every step of your pipeline.
With Great Expectations, you can define expectations for your data, such as ensuring that certain columns are present, or that certain values fall within a specified range. You can then use these expectations to validate your data as it flows through your pipeline, helping you catch issues early and ensure that your data is of high quality.
Here’s an example of how to use Great Expectations to define and validate data expectations:
import great_expectations as ge
import pandas as pd

# load a dataset into a Pandas DataFrame
df = pd.read_csv('my_dataset.csv')

# define expectations for the data
expectations = ge.dataset.PandasDataset(df).expect_column_values_to_be_between(
'my_column', min_value=0, max_value=100
)

# validate the data against the expectations
result = expectations.validate()

# print the validation result
print(result)
This code loads a dataset into a Pandas DataFrame and then uses Great Expectations to define an expectation that the values in the my_column column fall within the range of 0 to 100. The expectations.validate() method is then used to validate the data against the defined expectation. The result of the validation is then printed to the console.
Overall, Great Expectations is a powerful tool for managing data quality in your pipelines. When used in conjunction with dbt, it can help you build a comprehensive data quality management system that ensures your data is of high quality at every step of your pipeline.
boto3
Boto3 is a Python library that provides a simple and easy-to-use interface for working with Amazon Web Services (AWS) services, including S3, EC2, and Lambda. It allows you to easily interact with AWS services from within your Python code, making it a powerful tool for data engineers who need to work with AWS services as part of their data processing pipelines.
One of the powerful use cases of Boto3 is to work with AWS Lambda, which is a serverless computing service provided by AWS. With Lambda, you can run your code without provisioning or managing servers, making it an ideal solution for data processing tasks that need to be executed on demand. Boto3 provides a simple and intuitive interface for working with Lambda functions, allowing you to create, update, and invoke functions directly from within your Python code.
Here’s an example of how to use Boto3 to create and invoke a Lambda function:
import boto3

# create a Lambda client
lambda_client = boto3.client('lambda')

# define the function payload
payload = {
'key1': 'value1',
'key2': 'value2',
'key3': 'value3'
}

# invoke the Lambda function
response = lambda_client.invoke(
FunctionName='my_function_name',
Payload=json.dumps(payload)
)

# print the response from the Lambda function
print(response['Payload'].read())
black/sqlfluff
Black is a Python code formatter that makes your code consistent and easy to read. It automatically formats your Python code to conform to the PEP 8 style guide, which is the de facto standard for Python code style. By using Black, you can ensure that your code is formatted consistently across your entire project, making it easier to read and maintain.
Here’s an example of how to use Black to format a Python file:
# before formatting
def foo():
return   1+ 2


# after formatting
def foo():
return 1 + 2
As you can see, Black automatically formats the code to conform to the PEP 8 style guide, making it easier to read and understand.
SQLFluff, on the other hand, is a SQL linter that checks your SQL code for syntax errors, formatting issues, and other common mistakes. It helps you write high-quality SQL code that is easy to read, maintain, and debug. By using SQLFluff, you can ensure that your SQL code is consistent and error-free, making it easier to work with.
Here’s an example of how to use SQLFluff to lint a SQL file:
-- before linting
SELECT customer_name, order_total
FROM orders
WHERE order_total > 1000


-- after linting
SELECT
    customer_name
    , order_total
FROM
    orders
WHERE
    order_total > 1000
As you can see, SQLFluff automatically formats the SQL code to conform to best practices and identifies issues like missing commas or uppercase keywords.
Together, Black and SQLFluff are powerful tools for ensuring that your code is consistent, easy to read, and free of errors. By using them in your data engineering and data science projects, you can streamline your development process and write high-quality code that is easy to maintain and debug.
requests
Requests is a Python library that simplifies making HTTP requests in Python. It provides an easy-to-use interface for making HTTP requests to web services and APIs, making it an essential tool for data engineers and data scientists who need to interact with web services.
One common use case for requests is to interact with API endpoints. API endpoints are URLs that are designed to be accessed by computer programs, rather than human users. They allow you to retrieve or manipulate data from remote systems in a programmatic way. By using requests, you can easily make HTTP requests to API endpoints and receive data back in a structured format like JSON.
Here’s an example of how to use requests to make a GET request to an API endpoint:
import requests

response = requests.get('https://api.example.com/data')
data = response.json()
print(data)
In this example, requests is used to make a GET request to an API endpoint at https://api.example.com/data. The response is then parsed as JSON and printed to the console. This demonstrates how easy it is to retrieve data from an API endpoint using requests.
Overall, requests is a powerful tool for making HTTP requests in Python, and its support for interacting with API endpoints makes it a valuable tool for data engineers and data scientists who need to work with web services.
python-dotenv
python-dotenv is a Python library that simplifies the process of loading environment variables from .env files. Environment variables are key-value pairs that contain configuration information for a program, and they are often used to store sensitive information like API keys, database passwords, and other credentials.
Using python-dotenv, you can store your environment variables in a .env file and load them into your program using a simple API. This makes it easy to keep your sensitive information separate from your code, and it allows you to quickly switch between different environments like development, testing, and production.
Here’s an example of how to use python-dotenv to load environment variables from a .env file:
from dotenv import load_dotenv
import os

load_dotenv()

api_key = os.getenv('OPENAI_API_KEY')
print(api_key)
In this example, we use load_dotenv to load environment variables from a .env file, and then we use os.getenv to retrieve the value of the OPENAI_API_KEY environment variable. This demonstrates how easy it is to load environment variables from a .env file using python-dotenv.
Overall, python-dotenv is a useful tool for managing environment variables in Python, and it can be particularly helpful for personal projects where you want to keep sensitive information separate from your code. For example, if you were using GPT-3 via an API key, you could store the API key in a .env file and load it into your program using python-dotenv, keeping your API key secure and separate from your code.
dateutil
dateutil is a Python library that provides useful utilities for working with dates and times in Python. It extends Python’s built-in datetime module by adding support for a wider range of date and time formats, as well as additional functionality like time zones, relative date calculations, and more.
One of the most useful features of dateutil is its support for parsing dates from strings in a wide range of formats. For example, you can parse a date from a string like “2022-03-23” or “23-Mar-2022” using the parse function in dateutil:
from dateutil.parser import parse

date_str = '23-Mar-2022'
date = parse(date_str)

print(date)
In addition to parsing dates from strings, dateutil also provides a range of utilities for working with time zones, performing relative date calculations (like “two weeks ago” or “next month”), and more.
Overall, dateutil is a valuable tool for anyone working with dates and times in Python, and its support for a wide range of date formats and additional functionality makes it a powerful library for data engineers and data scientists alike.
faker
Faker is a Python library that provides a simple way to generate fake data for a variety of use cases. It allows you to generate realistic-looking data that can be used for testing, data anonymization, or just for fun.
One of the most useful features of Faker is its ability to generate realistic-looking names, addresses, phone numbers, and other personal information. This is fantastic for personal projects. For example, you can use Faker to generate a random name and email address like this:
from faker import Faker

fake = Faker()

name = fake.name()
email = fake.email()

print(name)
print(email)
In addition to generating personal information, Faker also supports generating other types of data like dates, times, IP addresses, and more.
Overall, Faker is a valuable tool for anyone who needs to generate realistic-looking data in Python. It can be particularly useful for testing data pipelines or anonymizing data for privacy reasons. Plus, it’s just fun to play around with!
In conclusion, these are just a few of the many amazing Python libraries for data science and data engineering. With Python’s extensive library ecosystem, the possibilities are endless. These libraries make it easier to analyze, process, and visualize data, which in turn leads to better insights and decision-making. I hope this list provides a starting point for your data projects and inspires you to explore further. Remember, the key to success in the data space is not just knowing the tools, but also being able to use them effectively. Happy coding!